Title: Average Monthly and Average Annual Precipitation 1961-1990, 1971-2000 and 1981-2010 by State
Originator: Oregon State University and the Oregon Climate Service at Oregon State University
Abstract:
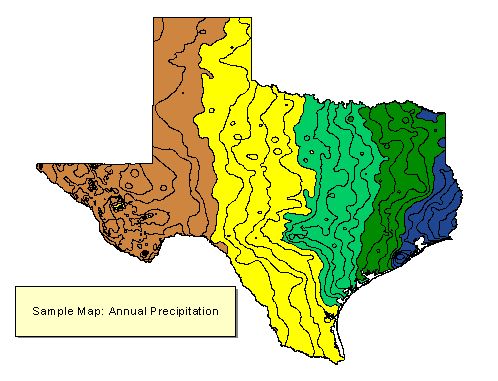
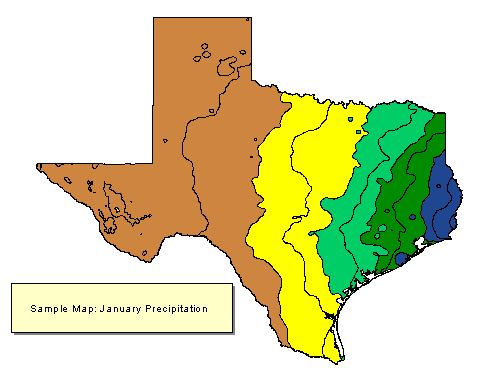
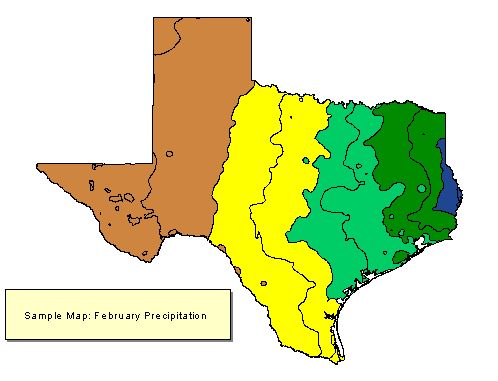
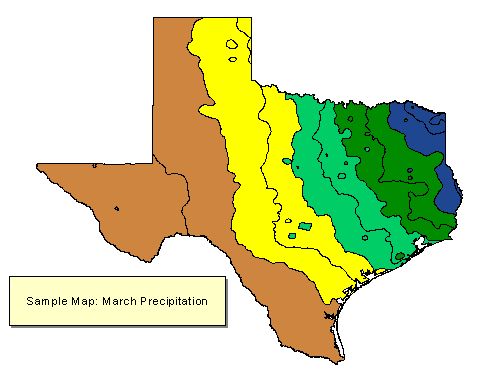
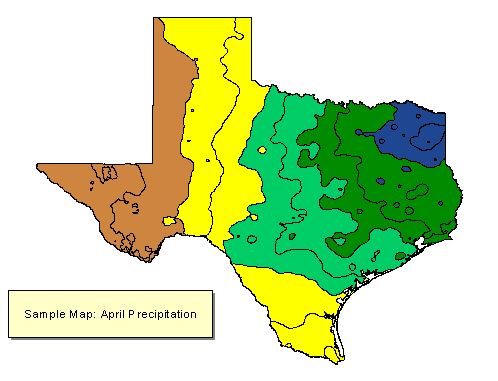
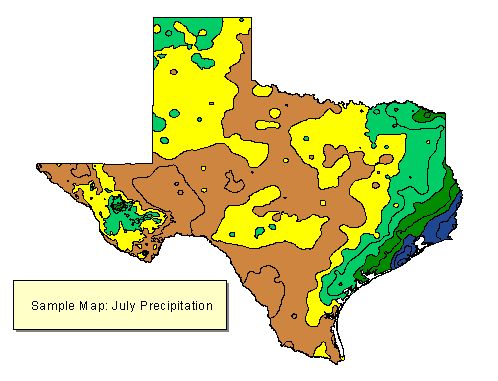
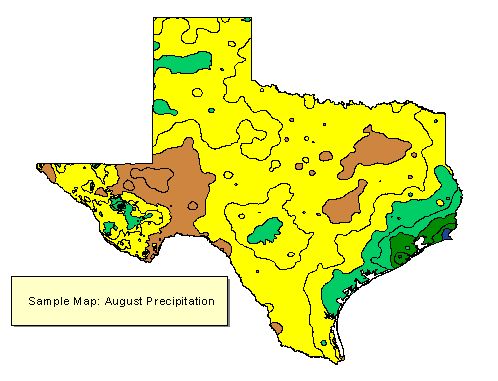
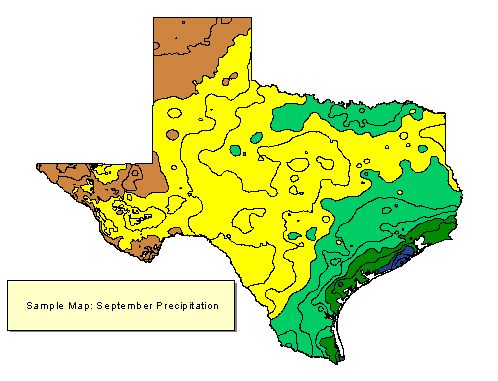
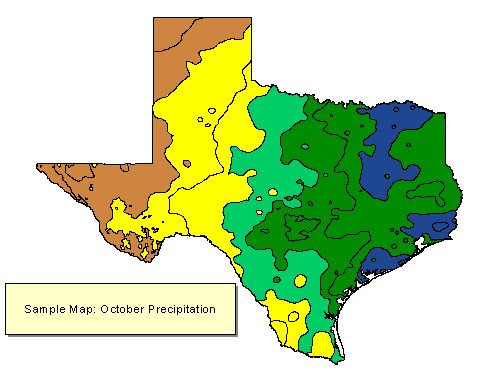
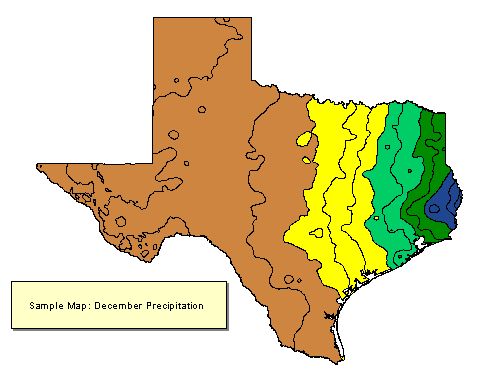
The data are average monthly and average annual precipitation for the climatological period 1961-1990, 1971-2000 and 1981-2010. The maps were created from 30 arc-seconds (~800m) PRISM derived grids. Manual and automated checks were made on the polygons to ensure no two adjacent polygons contained the same RANGE value.
Parameter-elevation Regressions on Independent Slopes Model (PRISM) derived raster data is the underlying data set from which the polygons and vectors were created. PRISM is an analytical model that uses point data and a digital elevation model (DEM) to generate gridded estimates of annual, monthly and event-based climatic parameters
There are many methods of interpolating precipitation from monitoring stations to grid points. Some provide estimates of acceptable accuracy in flat terrain, but few have been able to adequately explain the extreme, complex variations in precipitation that occur in mountainous regions. Significant progress in this area has been achieved through the development of PRISM. PRISM is well suited to regions with mountainous terrain, because it incorporates a conceptual framework that addresses the spatial scale and pattern of orographic precipitation.
For further information, the online PRISM homepage can be found at http://www.prism.oregonstate.edu
Format: vector polygon
Spatial Reference Information: Decimal Degrees, North American Datum 1983
Sample Annual map Sample January map Sample February map Sample March map Sample April map Sample May map Sample June map Sample July map Sample August map Sample September map Sample October map Sample November map Sample December map